


Hi Donald,
a similar approach (described in a paper by Connor Mayer) was recently pointed out by Stephen Carlson You are not allowed to view links. Register or Login to view.. From the few experiments I discuss in that thread, Mayer's software generates graphs that are very different from yours. I guess this depends on his normalization method: I should try different normalization methods and see if I can duplicate your results with Mayer's code.
Your plots seem indeed compatible with the abstract of Alin's paper. Here I have colour-edited one of your charts to make it more readable. I also manually added two lines according to what I see as visual clusters, also keeping You are not allowed to view links. Register or Login to view. in mind.
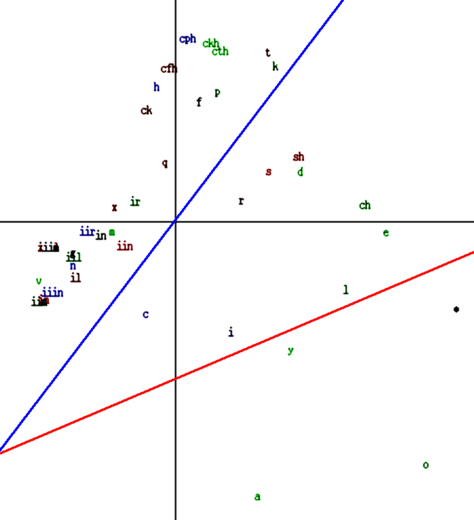
The symbols below the red line correspond to the characters that Guy identifies as most likely vowels: EVA:o, a, y.
The symbols between the blue and red lines are somehow "intermediate". The set includes 'i', 'e', and the "benches", comparably with what Guy identifies as possibly vowels, but with much less confidence than the three "circle-glyphs" (but this area includes other glyphs, and Guy's transcription system handles 'h' as an individual characters, so there also are significant differences here).
Consistently with Alin's finding, clusters in your chart appear to be diagonally oriented: i.e. they are based on both PC1 and PC2.
From your plot it is also clear that (as Alin says) similar characters behave similarly: the three circles are in the same area (though with considerable space separating them). In the "intermediate" area, the two benches and EVA:e are close to each other, as are 'r' and 's'. At the top of the chart, gallows and bench-gallows also form distinct diagonally-separated clusters. Of course, it would be interesting to read the whole paper, but my impression is that Alin's results are very close to yours.
a similar approach (described in a paper by Connor Mayer) was recently pointed out by Stephen Carlson You are not allowed to view links. Register or Login to view.. From the few experiments I discuss in that thread, Mayer's software generates graphs that are very different from yours. I guess this depends on his normalization method: I should try different normalization methods and see if I can duplicate your results with Mayer's code.
Your plots seem indeed compatible with the abstract of Alin's paper. Here I have colour-edited one of your charts to make it more readable. I also manually added two lines according to what I see as visual clusters, also keeping You are not allowed to view links. Register or Login to view. in mind.
The symbols below the red line correspond to the characters that Guy identifies as most likely vowels: EVA:o, a, y.
The symbols between the blue and red lines are somehow "intermediate". The set includes 'i', 'e', and the "benches", comparably with what Guy identifies as possibly vowels, but with much less confidence than the three "circle-glyphs" (but this area includes other glyphs, and Guy's transcription system handles 'h' as an individual characters, so there also are significant differences here).
Consistently with Alin's finding, clusters in your chart appear to be diagonally oriented: i.e. they are based on both PC1 and PC2.
From your plot it is also clear that (as Alin says) similar characters behave similarly: the three circles are in the same area (though with considerable space separating them). In the "intermediate" area, the two benches and EVA:e are close to each other, as are 'r' and 's'. At the top of the chart, gallows and bench-gallows also form distinct diagonally-separated clusters. Of course, it would be interesting to read the whole paper, but my impression is that Alin's results are very close to yours.